Quant Analyzer Report
StrategyTester_Angely for Abe deposit
Source: MT4Report| Symbol | GBPJPY | Period | D1 : 05.01.2005 - 30.12.2016 |
|---|---|---|---|
| Initial deposit | 10000.0 | ||
| Parameters | - | ||
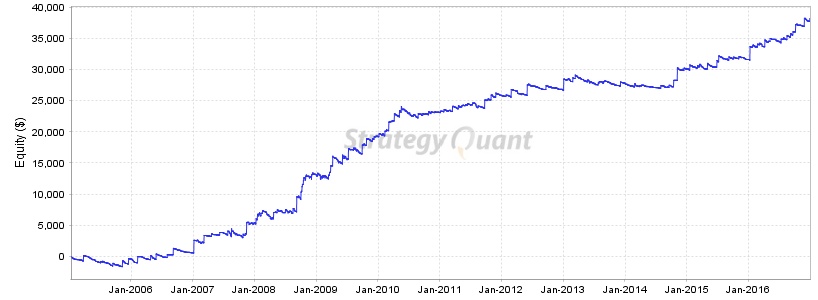
Total Profit
$ 38142
Profit in pips
43864 pips
Yrly Avg profit
$ 3179.73
Yrly Avg % ret
31.8 %
CAGR
13.99 %
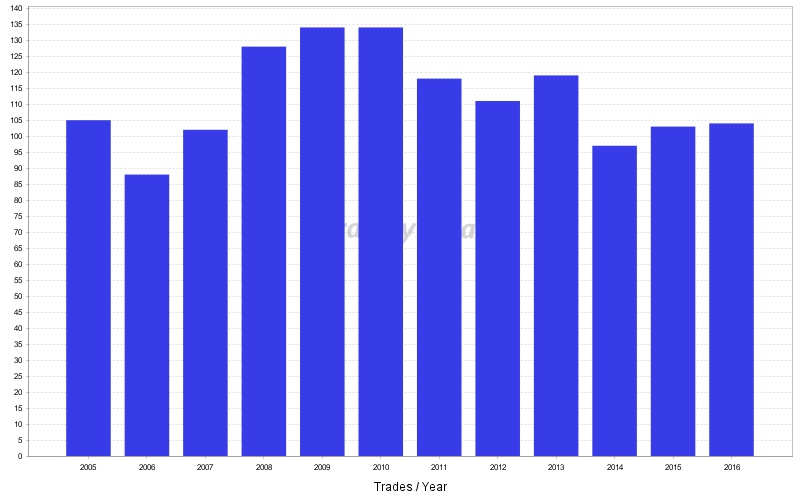
# of trades
1343
Sharpe ratio
0.11
Profit factor
1.68
Return / DD ratio
18.11
Winning %
26.21 %
Drawdown
$ 2106.35
% Drawdown
17.15 %
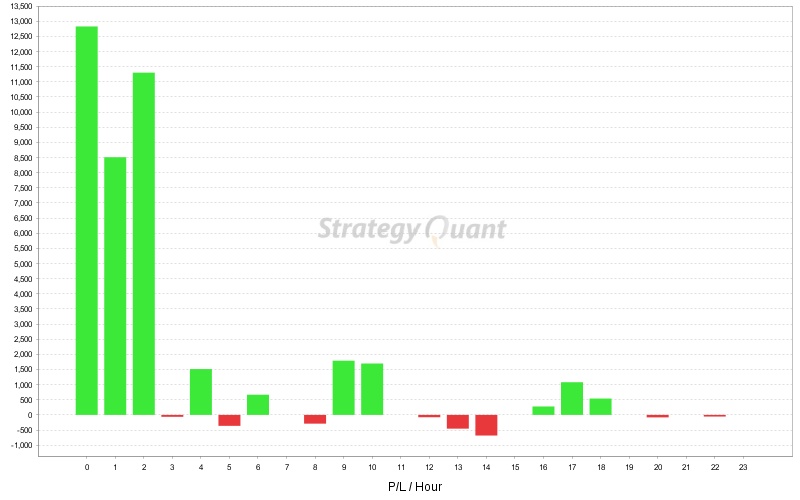
Daily Avg profit
$ 10.4
Mthly Avg profit
$ 264.88
Average trade
$ 111.97
Annual% / Max DD%
0.82
R Expectancy
0.46 R
R Exp score
51.85 R
SQN
5.1
SQN score
1.28
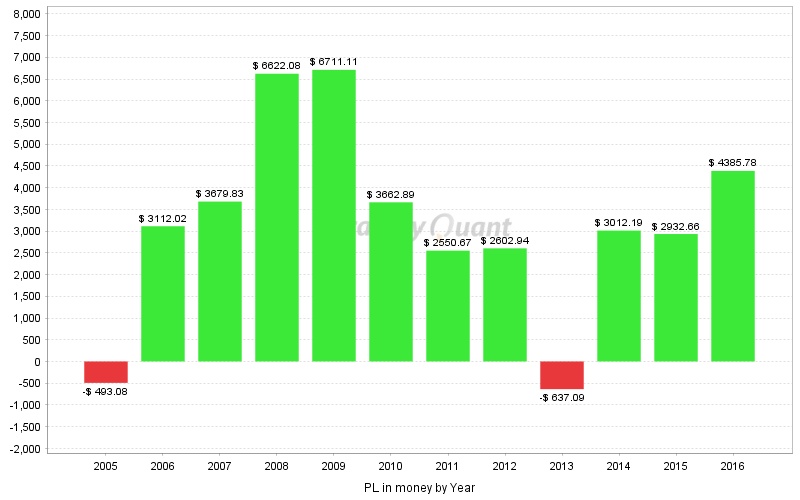
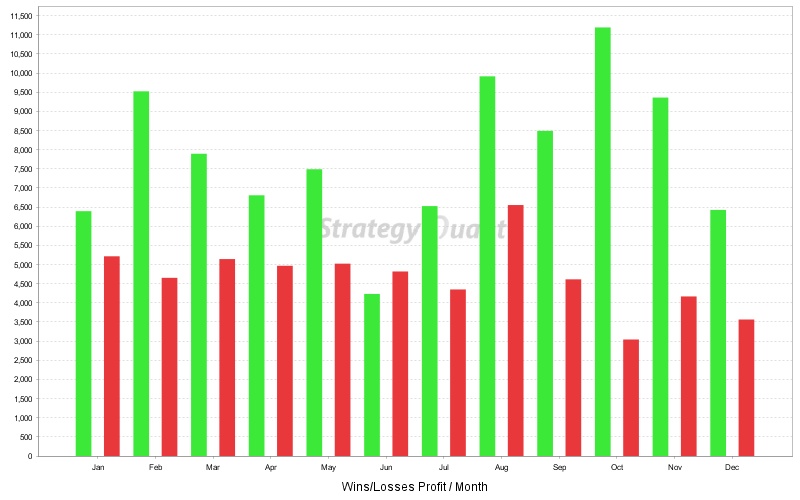
Monthly Performance ($)
| Year | Jan | Feb | Mar | Apr | May | Jun | Jul | Aug | Sep | Oct | Nov | Dec | YTD |
| 2016 | 167.58 | 430.26 | 4.84 | 680.42 | -203.73 | -298.76 | 471.95 | 776.58 | 1402.66 | -74.44 | 1078.05 | -49.63 | 4385.78 |
| 2015 | -265.52 | -103.38 | -50.04 | 567.62 | 264.07 | 670.98 | -62.58 | 173.44 | -92.15 | 174.25 | -189.79 | 1845.76 | 2932.66 |
| 2014 | -471.87 | 164.49 | 83.18 | -229.11 | 18.77 | 94.46 | -89.32 | -263.54 | 790.45 | 2346.77 | -202.41 | 770.32 | 3012.19 |
| 2013 | 54.31 | 632.86 | -433.54 | -116.27 | -597.04 | -193.08 | 291.59 | 66.86 | -293.57 | -337.62 | 482.79 | -194.38 | -637.09 |
| 2012 | 37.47 | 893.56 | -332.73 | 566.14 | 503.57 | -179.25 | -154.49 | 6.27 | 35.26 | -162.61 | 1573.72 | -183.97 | 2602.94 |
| 2011 | 235.66 | -69.84 | 485.91 | 95.31 | 331.85 | 7.64 | -74.02 | 998.78 | -219.25 | 789.29 | 301.99 | -332.65 | 2550.67 |
| 2010 | 294.87 | 1641.44 | 1336.42 | -486.13 | 1189.95 | -612.73 | -247.11 | 86.74 | 39.4 | 488.33 | -167.73 | 99.44 | 3662.89 |
| 2009 | -124.54 | -15.6 | 2688.76 | 154.48 | 748.43 | -662.75 | 1827.47 | -461.26 | 803.41 | 953.6 | 395 | 404.11 | 6711.11 |
| 2008 | 586.04 | 335.49 | -942.53 | 832.14 | 240.29 | 274.33 | -642.44 | 2634.59 | 715.16 | 2711.59 | 1.13 | -123.71 | 6622.08 |
| 2007 | -202.65 | 1068.84 | -197.31 | 634.78 | -85.8 | 588.5 | 859.37 | -1644.02 | -238.58 | 288.93 | 1706.69 | 901.08 | 3679.83 |
| 2006 | 473.34 | 0 | 293.61 | -473.05 | 570.11 | -405.5 | 315.05 | 1010.23 | 873.9 | 688.77 | -166.97 | -67.47 | 3112.02 |
| 2005 | 393.63 | -107.17 | -185.65 | -385.72 | -514.82 | 129.93 | -318.44 | -23.52 | 61.1 | 282.89 | 381.53 | -206.84 | -493.08 |
Stats
Strategy
| Wins/Losses Ratio | 0.36 | Payout Ratio (Avg Win/Loss) | 4.73 | Average # of Bars in Trade | 0 |
| AHPR | 0.12 | Z-Score | -6.83 | Z-Probability | 0 % |
| Expectancy | 28.4 | Deviation | $ 220.6 | Exposure | -999999999 % |
| Stagnation in Days | 595 | Stagnation in % | 13.59 % |
Trades
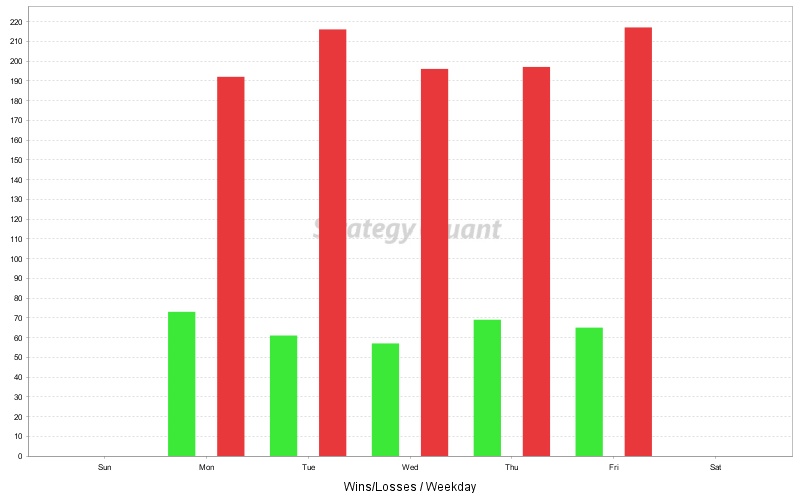
| # of Wins | 325 | # of Losses | 915 | # of Cancelled/Expired | 103 | ||
| Gross Profit | $ 94256.32 | Gross Loss | $ -56114.32 | Average Win | $ 290.02 | Average Loss | $ -61.33 |
| Largest Win | $ 1352.63 | Largest Loss | $ -448.71 | Max Consec Wins | 7 | Max Consec Losses | 24 |
| Avg Consec Wins | 1.63 | Avg Consec Loss | 5.09 | Avg # of Bars in Wins | 0 | Avg # of Bars in Losses | 0 |
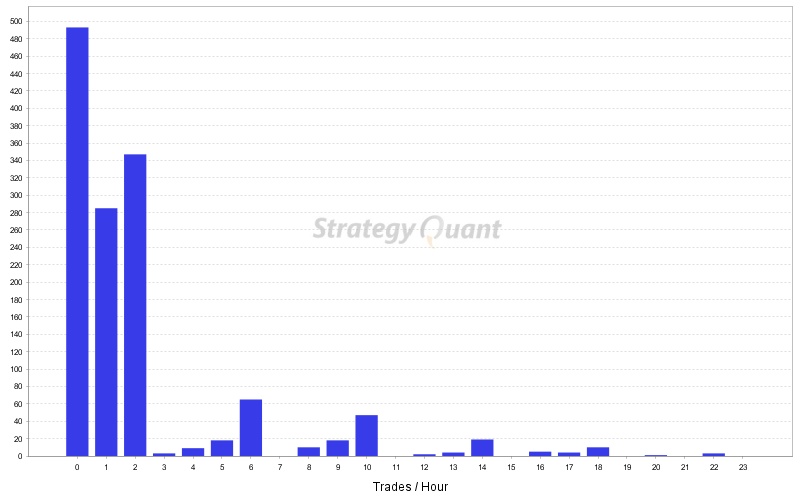
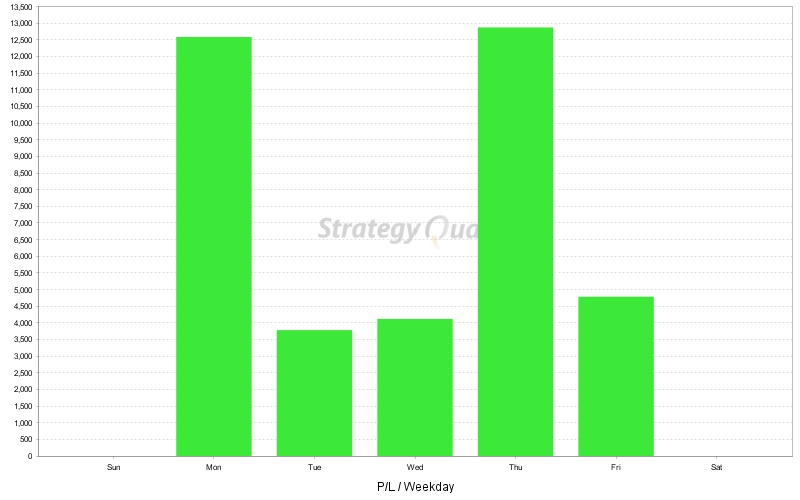
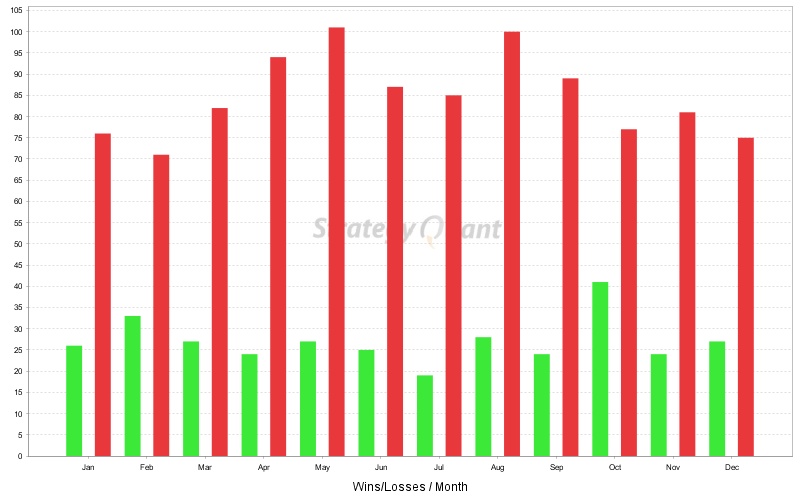
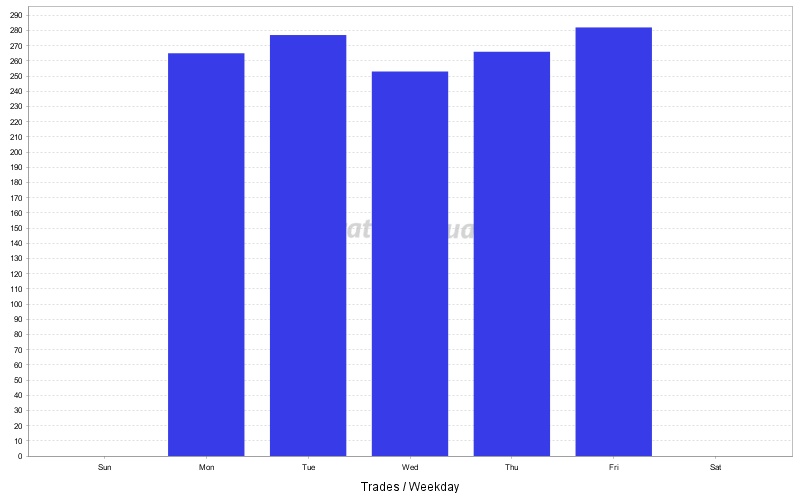
Charts
Click on the chart to see bigger image